Gatling is a load and stress testing tool with high performance based on Scala. In our previous post we have discussed on Gatling and things to know to work with Gatling. In our last post we have shown on how to install and run Gatling and its folder structure. Now we will discuss on how we can conduct a simple load test using Gatling.
We will do load testing on the following test case.
- Open the Browser and go to the site : http://www.bing.com/
- Enter the text “Gatling” at search text box
- Click Search button and Gatling related page with link is displayed
- Click on the link text “Gatling - Official Site”.
In Gatling, we call this test cases as scenario that needs to test load and stress. Scenario is the real user activity on the application.
Step 1 : Configure Browser
In order to record our scenario using Gatling, we need to configure our browser proxy settings at first. The following steps will show you how to configure chrome browser for Gatling recording.
In case of other browsers almost same steps can be followed. For more details you can see one of my post on browser proxy settings.
Step 2 : Recording the Scenario
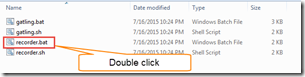
- A command prompt window is displayed.

- Recorder window is displayed.

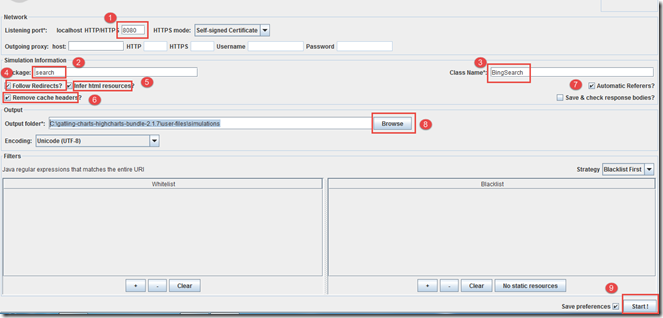
- Enter the port number in the local host box ( In my case 8080).
- Enter Package name as “search”
- Enter class name as “BingSearch”.
- Check “Follow Redirects”, “Infer HTML resources”, “Remove Cache Headers” and “Automatic Referrers” options.
- Select the output files path. In my case (C:\gatling-charts-highcharts-bundle-2.1.7\user-files\simulations). Note that it is good to select simulation folders by default so that user does not need to copy the recorder file at the time of load testing.
- Keep all the other options same. Don’t change any existing options.
- Click on Start button.
- Open Google chrome browser.
- Go to the URL : http://www.bing.com/
- Enter the text “Gatling” at search text box
- Click Search button.

- Gatling related page with link is displayed
- Click on the link text “Gatling - Official Site”.

- Close the browser.
- Click on “Stop & save” button and Gatling recorder window is closed.

- Recorder file named “BingSearch.scala” is saved created and saved to “C:\gatling-charts-highcharts-bundle-2.1.7\user-files\simulations\search” directory.
Note that file name is the class name with extension .scala and it is located at folder named “search” that is same as the package name that we entered at the recorder window. This folder structure should be followed for load testing.

- If we open the scala file by notepad++ it displays script using Scala programming language. We will discuss more on scala script in our future post.
- We can configure user through this script. By default it sets load for single user. It has setUp() method to configure user.

In our future post we will show how we can modify the script to configure different load.
Step 3 : Executing load testing using Gatling
- Go to the bin folder (in my case : C:\gatling-charts-highcharts-bundle-2.1.7\bin)
- Double click on the “gatling.bat” file.

- A command prompt window is displayed and then load testing instructions are displayed on the command prompt window. In our case, it shows the test name as “BingSearch.scala” at the command prompt. And the command prompt displays the series of instructions.
- Command prompt window look like the following now.

- Since there is only one simulation file default simulation id is “bingsearch”. So enter this name and press Enter key.

- After pressing Enter key from keyboard, this window look like the following. It ask for optional run description.

- Most of the cases run description will be the objective or title of the test cases. Number of users and nature of load. It is mean that anybody can understand about the goal of the load test to read this description.
- In my case, “Search a word by Bing. Number of User : 1”. Press Enter key.

- After pressing Enter key simulation starts.

- After finishing simulation it displays the result link that generate report in HRML format.

- Copy the report path and press enter key to close the command prompt window.
- Go to the result path (In my case : C:\gatling-charts-highcharts-bundle-2.1.7\results\bingsearch-1441322261378) and it shows the sets of html file.

- Double click index.html file to open the report and it opens the report in chrome browser.

We will discuss details on report feature in our future post.
Happy Load testing using Gatling!!!…


