JMeter is a web load and performance testing tool that has been used for a long time. As an open source tool it is popular to many web load and performance tester. I am using it for a long time. In my previous post on JMeter I have shown how to download and install JMeter.
In this blog, I will show you how to record http request and perform a Load test using JMeter. Our test case steps for load testing is given below:
- Open the Browser and go to the site : http://www.bing.com/
- Enter the text “JMeter” at search text box
- Click Search button and JMeter related page with link is displayed
- Click on the link text “Apache JMeter - Apache JMeter™”
Step 1 : Start JMeter Application
Start JMeter windows application by double clicking on the file named ApacheJMeter.jar at the bin directory (In my case, C:\apache-jmeter-2.13\bin)
Tips : Make a desktop shortcut for ApacheJMeter.jar file so that every time you do not need to visit bin folder.
Note that I am using the latest JMeter version 2.13
JMeter window is displayed. Inspect that it has two panels. Left panels shows the options part or planning part where tester can add different options for testing purpose. Right panel displays the details window where tester can configure different option.

Step 2 : Creating Test Plan
- Click on Test Plan from Left panel
- Note that clicking on Test Plan from Left panel will display plan details on right panel.

- Remove the default text “Test Plan”
- Enter the text “Bing Search” in the Test Plan Name text box
- Click on Workbench option in the left side and inspect that Default Test plan name changes to “Bing Search”

Step 3 : Adding Thread Group
In order to simulate the user there is an option Thread Group in JMeter. In our load testing we simulate 5 users in every second.
- Right click on the test plan “Bing Search” at left panel.
- Click on Add>Threads(Users)>Thread Group

- Thread Group option is added at left panel under Bing Search

- Rename the thread group name “Load Settings”
- Keep the Option “Continue” as Sampler Error
- Change the thread properties option Enter 5 at “Number of Threads(Users)“ field
- Enter 1 at Ramp-Up Period (in seconds)
- Keep Loop count field “1”
- The thread group window looks like the following figure:

Step 4 : Adding a recording controller
- Right click on the Load Settings Thread and click Add>Logic Controller>Recording Controller

- A new recording controller is added and rename the controller as “Search by Keyword”.

Step 5 : Adding HTTP(s) Test Script Recorder
After configuring thread group we need to record the http request. In JMeter, there is a tree node in left panel called workbench. We have to add a HTTP(s) script recorder (proxy server) that will record the HTTP(s) request sent from browser.
- Right click on WorkBench
- Click on Add>Non-Test Elements>HTTP(s) Test Script Recorder

- HTTP(s) Test script recorder is added.
- Keep the recorder name unchanged.
- Keep the port 8080.
- Select Target controller as Search by Keyword. As a result when recording starts it adds HTTP requests to Search by Keyword controller section.

Note that if you add multiple controller you can change controller from Target controller before recording and record on that section.
Finally the HTTP Test script recorder looks like the following.

Step 6 : Configure Browser settings
- Now open the Browser window where the web application will run and change its Proxy server settings. We have to configure any of the browser that we use for recording.
- For Firefox Browsers
- Open Firefox Browser
- Go to Tools->Options

- Options page is displayed, Note that I am using Firefox version 38.0.5
- Click on Advanced Tab
- Click on Network sub tab
- Click Settings button of the Connection area.

- Connection Settings window is displayed
- Select Manual Proxy configuration
- Enter HTTP Proxy as “localhost”
- Keep port as “8080”
- Make sure that “Use this proxy server for all protocols” option is checked
- Click OK button of Connection Settings window

- Open Internet Explorer
- Go to Tools>Internet Options

- Internet options window is displayed
- Click on Connections tab
- Click on LAN Settings button

- LAN Settings window is displayed
- Uncheck automatically detect settings
- Check the “Use the proxy server for your LAN” options
- Type address as “localhost” and port as “8080”
- Click OK button of the LAN Settings window

- Click OK button of Internet Options window

- For Chrome Browser
- Open Chrome Browser
- Click on Customize and control google chrome button located at top right corner. A drop down menu is displayed.


- Settings page is displayed.
- Scroll down to the bottom of the page and click on Show Advanced Settings link to expand the page.

- Click on Change Proxy Settings…

- Internet Properties window is displayed and click on Connections tab.
- Click on LAN Settings button.

- LAN Settings window is displayed
- Uncheck automatically detect settings
- Check the “Use the proxy server for your LAN” options
- Type address as “localhost” and port as “8080”
- Click OK button of the LAN Settings window

- Click OK button of Internet Options window
- Close the browser window.
Step 7 : Recording HTTP(s) request
- Go to Workbench.
- Click on HTTP(s) Test Recorder.
- Click Start button of the recorder window.

- Following window might be displayed and click on OK button.

- Recorder is starting. Note that start button is disabled at that time.
- Open the browser that has been configured for recording. In my case it is chrome browser.
- Execute the test case.
- Go to the site : http://www.bing.com/
- Enter the text “JMeter” at search text box
- Click Search button and JMeter related page with link is displayed

- Click on the link text “Apache JMeter - Apache JMeter™”.

- JMeter page is displayed.
- Close the browser window.
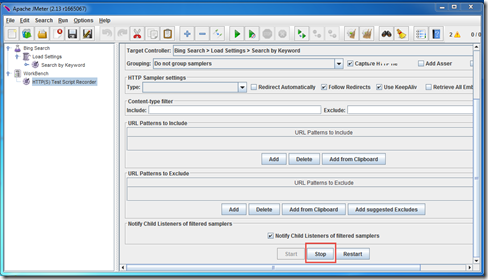
- Click Stop button of the HTTP(s) Test Script Recorder.

- Now double click on Search by Keyword controller to see the request.

Step 8 : Adding Listener to view the result
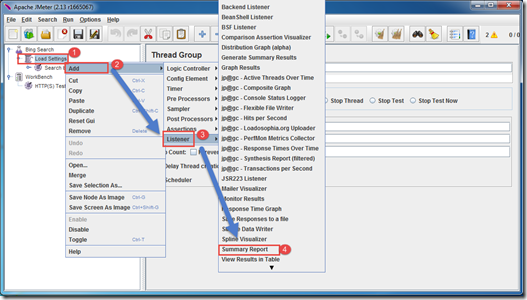
- Right click on the Thread group Load Settings
- Click on Add>Listener>Summary Report


- Add another Listener named View result in Table by the same way.

- Add another Listener named Graph Result by the same way.
Note that we will discuss more on Recording controller and Listener in our future post.
Step 9 : Saving JMeter Test
- Click on Save button from Toolbar to save the test.

- Select a location and enter the Test Name Bing Search.jmx

Note that JMeter ask for saving before executing the test.
Step 10 : Executing Load Test
- Go to Thread Group Load Settings
- Click on the Start button from tool bar.

- JMeter starts executing the Load.
- At the time of Load testing Start button is disabled and red color Stop button is enabled.
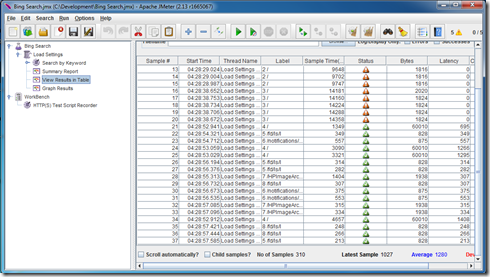
Step 11 : Inspect Load Test Result
After completing the load test inspect the result from Listener.


Note that each report has so many options. We can save the report data and submit for analysis.
We will discuss more on JMeter reports on our future posts.
Thant’s all for now…
Thank you for following it….
Happy Load testing with JMeter!!!…..


